


Wide-angle view of a marketing analytics dashboard on dual monitors in a Miami agency office, campaign performance graphs and revenue attribution charts visible mid-workflow, bright studio window light from the left, no people
— Revenue-Level Proof

Real Campaigns. Audited Results. No Vanity Numbers.

Every case study below starts with a specific business problem, a measurable baseline, and a strategy built around the gap. The numbers shown are tied to revenue, not reach.
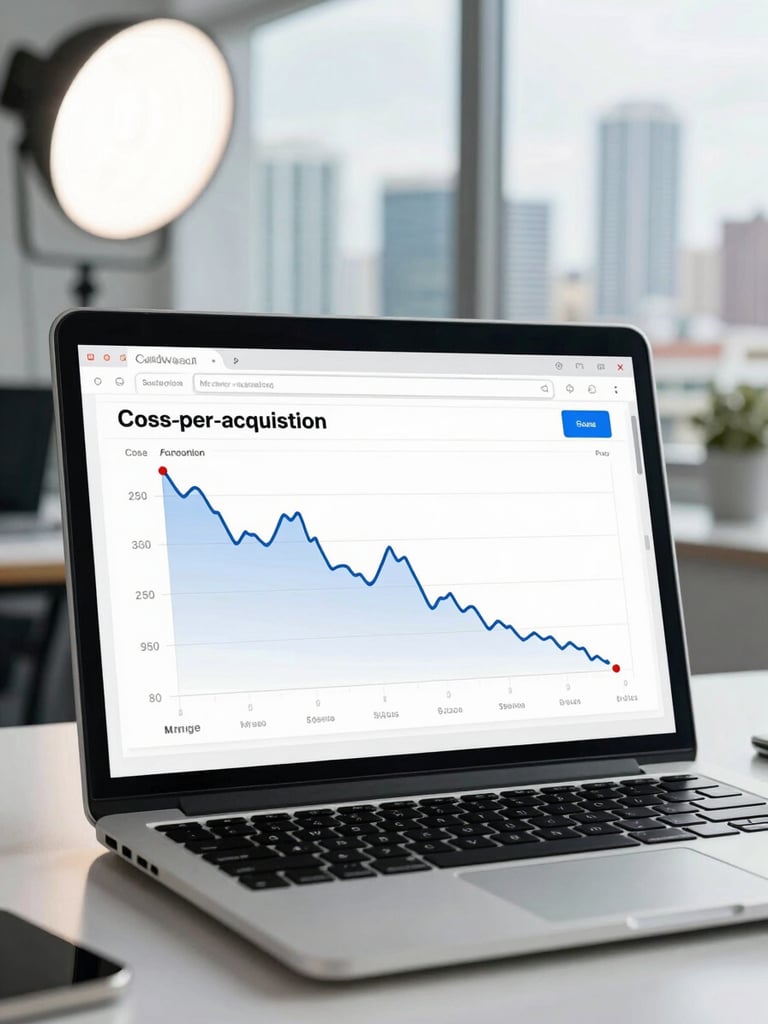
Close-up of a paid search campaign dashboard showing cost-per-acquisition trend line dropping sharply over 90 days, bright studio light on a laptop screen in a clean agency workspace, Miami skyline blurred in background window
Wide shot of a content strategy session in a modern conference room, laptop showing keyword ranking chart with steep upward curve, team members reviewing printed content calendars on a white table, bright natural window light
Medium-wide shot of a social media campaign review on a large monitor, Instagram and LinkedIn ad performance metrics visible, a diverse team at a standing desk in a bright Miami office, studio lighting, no posed smiles
/ Campaign Breakdowns

Methodology Exposed. Results Verified.

Paid Search — Retail

64% Drop in Cost Per Acquisition

Audited a mid-sized e-commerce retailer's Google Ads account and found 38% of spend concentrated on broad-match terms with zero purchase attribution. Rebuilt keyword architecture around buyer-intent signals.

Outcome: CPA fell from $112 to $40 within 90 days while monthly revenue grew 29%. No budget increase required.

SEO & Content — B2B SaaS

3.1x Organic Pipeline in Eight Months

A SaaS company had 900 monthly organic sessions and zero pipeline from search. We mapped competitor keyword gaps, rebuilt their content architecture around commercial-intent clusters, and eliminated 47 cannibalizing pages.

Outcome: 9,400 monthly sessions and $280K in attributed pipeline by month eight. Content cost paid back in month five.

Social Media — Hospitality

41% Increase in Direct Booking Revenue

A Miami boutique hotel was spending on brand awareness posts that showed engagement but zero booking correlation. We rebuilt the social funnel around direct-response creative tied to booking windows and seasonal rate data.

Outcome: Direct booking revenue up 41% year-over-year. OTA dependency dropped by 18 percentage points in the same period.

• Aggregate Client Impact

Numbers Across All Active Accounts

$4.2M

3.8x

11 Verticals

Industries served, from SaaS and hospitality to retail and professional services. Same analytical process, adapted to each.

Attributed client revenue generated across active campaigns in the past 12 months.

Average return on ad spend across paid search and social campaigns, measured at the revenue line.

Ready to See What Your Marketing Actually Earns?

We audit before we propose. Book a free consultation and we'll identify exactly where your current spend is underperforming before any contract is signed.